Scientific & Social Commentary by | D E S M O N D | T H E | O M N I D I M E N S I O N A L ™
Would You Like Some Ice With Your Glass of Earth?
Consensus has no place in science…and although that is reality, some people who are actually employed to masquerade as “scientists” have a problem with reality. No matter how many attempts that have been made, some willing sacrifice themselves and humility just so they’re able to keep their jobs and put food in the mouths of their children by killing the future of other children that are now pawns in the game–and thatgame is The Lie™ that’s being perpetuated by the so-called “scientific community“.
I had stated last monththat there will be many falsehoods that will continue to be pilfered out amongst the masses in regards to the ongoing popularization of “things scientific“. A lot of those falsehoods occur on the premise of faulty and skewed methods that are utilized in the construction of the data [climate data, in the manner of speaking]. What passes for a scientific method today is an outright lie. You can construct a method in such a way as to skew the results. The discovery of flawed methodologies occurs when others use your method to replicate your results–and they cannot. The greatest example of this occurrence is the failed hypothesis for “global warming/climate change”. The hypothesis cannot be replicated which indicates that the method is seriously flawed, if not intentionally skewed. The beauty of the scientific method is that it is self-correcting as long as no interference exists. If you were to state that humans are not impacting the climate, you’d be called a liar by those claiming to be “scientists” yet they’re the ones that willingly participate in The Lie™. They’ll retort back with loaded questions of their own which is demonstrable of the weaknesses in the positions on which they stand. They look for positive feedback loops and yet find it incredibly difficult to comprehend that not everything creates a positive feedback loop. Reality states that humans are not and do not cause the polar ice caps to melt, however the melting of the ice caps are indeed part and parcel of the glaciation process. This occurs during what’s known to only a few [a few with common sense] as an interglacial period. A smart person would know the answer to the following inquiry:
What does the Earth do during an interglacial period?
The majority of people that have fallen hook-line-and-sinker for the “global warming” hoax do not have the intelligence to understand that temperatures increase during an interglacial period…and by “inter”, I mean in-between glacial periods (or, “ice ages” as the common folk would say). Not only that but this current inter-glacial period that we’re living in today is yet the coldest inter-glacial period in comparison to the seven previous inter-glacial periods over the last 800,000 years. There were numerous interglacial periods in which CO2 and other greenhouse gases were higher in significant amounts with some estimates as much as 9,000 ppm for CO2, so please spare me the nonsense about CO2. You have that absent-minded, live-action mannequin that dons a bow tie that had whipsawed himself into a “debate” with some Bible-thumping dolt from Australia earlier this month and, needless to say, he’s a climate change proselytizer; a moron masquerading as a “scientist” with no other cause for living except to persuade gullible Gen Y-parasites to join his church and partake in the baptism of consensus.
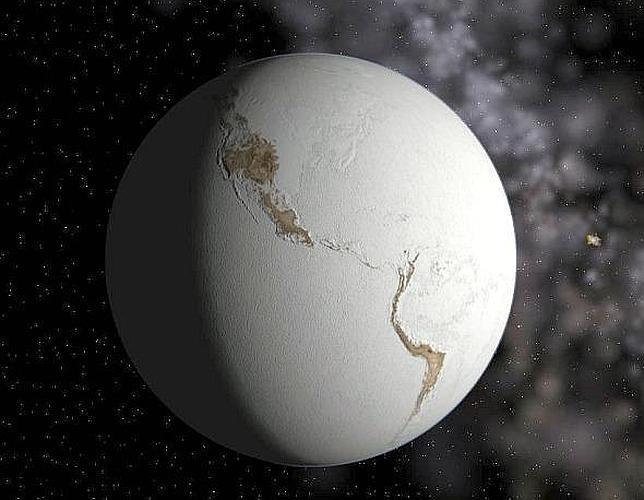
In the picture up above, that is what Earth looks like in its normal form.
Do you suppose that someone who’s an adherent to the “global warming” doctrine will admit to the millions that have been duped by belief [and not scientific fact] that, as of January 2013, the Earth had reached its closest point to the Sun and from that period on, the Earth had begun to move further away from the Sun? The answer to that question is an obvious “No” and the reason why is because no one that clings to the “global warming” doctrine is willing to let his or herself look like the complete moron that they truly are by admitting that nor would they stand there and be made a fool when someone inquiries them on how can the Earth be “warming up” if it’s now moving further away from the Sun.
In further reference to the picture up above, you have to understand that there is a relationship between sea level claims and the glaciation process. The picture is a depiction of what Earth resembled circa 10,500 BCE and shows how glaciated the Earth is when it’s not in an inter-glacial period. There are conflicting views amongst actual scientists and some ponder if the Earth was even more heavily glaciated than what’s depicted up above. During this time [~10,500 BCE], sea levels purportedly were between 600-800 feet lower than they are today and you can see that those scientists that support sea levels ~600 ft. level to view the Earth being less glaciated than those scientists who support sea levels ~800 ft. level to view the Earth being more heavily glaciated although there are other scientists that support the view that though sea levels could have been as low as ~800 ft. level, the Earth could have been less glaciated yet had more snow cover for extended time periods. I shouldn’t even have to iterate to anyone taking the time to read this blog post that the picture up above depicts not only how our planet, Earth is the majority of the time but how the picture also shows, in succinct detail, how hostile Earth’s environment can be to mankind and suffice to say, that such an environment will not support a population of around ~6.7 to 7 billion people that currently call Earth “home”.
So, what can “climatologists” say about ocean currents? What conclusion can they draw about ocean current circulation that originated in the South Polar region? They can’t answer those questions, but I can, and I tell you that the reason why ocean currents are different today than they were eons ago is because close to twenty-three million years ago, action of the tectonic plates created what is now the Panamanian Isthmus and that is what changed, perpetually (geologically speaking) how ocean currents circulated–causing the Earth to enter into glacial states. Before this, the Earth’s climate was consistently a certain way until this action (tectonic plates shifting) started to occur in the sea that, at the time, existed and separated the tectonic plates in the North American part of the sea and the tectonic plates in the South American part of the sea. After the tectonic plates shifted, ocean currents from the South Polar region began to circulate into the South Atlantic and South Pacific oceans and you can say the same in regards to the North Atlantic and North Pacific oceans as tectonic plates began shifting and causing ocean currents that originated in the North Polar region began to move south into the North Atlantic and North Pacific oceans, causing a permanent change in the currents, forming glaciation-warming-glaciation-warming cycles that track with what’s known (by a few) as the Milankovitch Cycle.
Every 100,000 – 150,000 years, your Earth, your “home”, goes through periods of glaciation lasting as long as 100,000 – 150,000 years which are then followed by an interglacial “warming” period that averages ~12,000 before returning to another period of 100,000 of glaciation. This is well-documented science. I’m well aware that the “scientific community” clashes on whether or not our Sun is in a phase known as a “solar minimum”; and I’m well aware that part of the clash resides on which particular “minimum” that phase may be: the Dalton minimum; the Spoerer minimum; or the Maunder minimum. For those not in-the-know, a minimum is an extended period of time of no activity from the Sun or a period in which activity from the Sun occurs in different latitudes of the Sun. Doing a study in spherical geometry will help you all a lot in understanding this phenomena. Try to fixate on how your Earth and the other planets are for a second: your Earth and the majority of the other planets sans Mars reside in what is called the plane of the ecliptic, effectively the solar equator. Sun spots and solar flares that occur between 45° N and 45° S have a causal effect on your Earth but solar flares and sun spots that occur outside of those relevant latitudes, especially in the aforementioned polar areas of the Sun, render no effect on Earth. This is why it’s damn near asinine to read articles where “scientists” get anxious over seeing M-class solar flare activity yet the direction of the solar flare activity isn’t even heading in the direction of Earth. Spoerer minimum is eight back-to-back eleven-year solar cycles with no activity; the Maunder minimum is six back-to-back eleven-year solar cycles with no activity. The [solar] minimums occur in the following cyclical order–Spoerer-Maunder-Dalton. Last month, I had made a reference to the position that the Earth is currently in, and it rests on the fact that our Earth began moving further away from the Sun back in January of 2013 after reaching its nearest point to the Sun last month of this year (2014). Some would run with that and say that I’m in support of “global cooling”. I never made such a contention. Folks, please realize that what you’ve all come to “love” and dearly regard as “science” isn’t science–not in the least bit. Not when it’s politicized or politically influenced.
That’s right, politicized. For those of you in pursuit of a graduate degree, I’m sure you’re all familiar with the pressures of “publish or perish”. That’s how competitive post-graduate studies are; it’s that cut-throat. Do yourself a favor and read my post on the subject of “peer-review”. If you were to take the time to read some of the nonsense in so-called “peer-reviewed journals and articles” that support global warming/climate change, you’d find damn near 10x more pusillanimous “weasel terminology” on a per page basis than there are participles and prepositions. The conclusions are plain wrong and they’re all based on skewed data. On the bright side, do know that for every paper that’s written in support of global warming/climate change, there are at least two written against the proliferation of the aforementioned hoax. One integral part of the hoax of global warming/climate change is the claim that there are thousands of peer-reviewed publications that supposedly “prove” climate change. As I’ve stated before, not everything claiming to be “science” is science nor qualifies as science–and oftentimes, science is more wrong than it is correct. For people (especially today’s young and highly-impressionable generation) to blindly accept something simple because they heard it being bellowed from the mouths of scientists is equally absurd as being accepting of some nonsense written in a supposed “sacred text”. As an example of science being wrong, from 1820 to 1995 we were told that it was impossible for life to exist on the continent of Antarctica. Science was wrong about that, was it not? Answer: Yes, science was wrong. With that said, the “reality” of global warming is nothing more than a political position that is so pathetically weak, “scientists” have to continuously re-define “global warming” over and over again and evolve it into some vague and ambiguous term just to get people to pay attention to them. And please, miss me with that “well Desmond, every credible scientist is in support of climate change”. Really? “Every credible scientists” once said that there were no mountains on the continent of Antarctica. Were they right? Answer: No, they weren’t. See folks, science is not infallible, it is subject to the “laws” of economics just like everything else on the planet. It is proper and just to question science and scientists.
The Gamburtsev mountain range was discovered in 1958 during International Geophysical Year by a Soviet Antarctic expedition and named after Grigoriy Gamburtsev, a Russian geophysicist. It is postioned deep in East Antarctica, lying below the highest, and perhaps the coldest, place on the East Antarctic Ice Sheet – Dome A.
Back in 1958, “every credible scientist” was adamant that mountains could not have existed on the continent of Antarctica. Do yourself a favor and make your way to your local library if you’re curious as to know why this was the “consensus” on Antarctica because you’re not going to find any reference to the high school science textbooks and university science textbooks that were written by the scientific knuckleheads of the 1940s and 1950s who were in support of that view online (oh, the convenience). In the same year, the US Geophysical Survey Team borrowed a ground radar unit from the U.S. Army and the team had set it atop a glacier in Antarctica and the result had imaged mountains. The 70 and 80 space shuttle missions used ground-penetrating radar to map the Earth and this is how the lakes and rivers in Antarctica were discovered. Please bear in mind that the Earth was not accurately measured until the 1980s and 1990s in part thanks to the space shuttle missions when those missions engaged in surface mapping that were complemented by ground-penetrating radar experiments conducted during those missions. Understand that your Earth–this Earth, planet Earth–is not a sphere yet it is a spheroid, therefore the radius of Earth is known to vary at each point along the equator where longitudinal lines cross and also varies at each point along given meridian that’s north or south of the equator where longitudinal lines cross. You also have to factor-in that meridional lines vary in length. I’m sure you’ve all heard of the “meter”, correct? Well, the meter has been redefined numerous times since there are many wavelengths in the orange-red spectrum in radiation–hence, the meter was then redefined as the distance that light travels [in a vacuum] over a period of time.
Let’s take ferroin, as an example. It appears dark orange. Does that means that it absorbs all wavelengths with the exception of a narrow band in the orange-red range? Answer: No. That is what’s implied in terms of meter. The longitudinal and meridional lines will vary in lengths as much as wavelengths vary in the color/compound color spectrum.
In reference to East Antarctica:
Here we analyze the three available 340 kyr East Antarctic ice core records alongside input from GCM modelling. We show that for warmer interglacial periods the relationship between temperature and the isotopic signature varies among ice core sites, and that therefore the conversions must be nonlinear for at least some sites. Model results indicate that the isotopic composition of East Antarctic ice is less sensitive to temperature changes during warmer climates. We conclude that previous temperature estimates from interglacial climates are likely to be too low. The available evidence is consistent with a peak Antarctic interglacial temperature that was at least 6 K higher than that of the present day —approximately double the widely quoted 3 1.5 K (refs 5, 6)
Evidence for warmer interglacials in East Antarctica ice cores.
So, what the above article is telling you is that this current inter-glacial period that we are living in today is factually the coldest inter-glacial period on record in comparison to the last eight inter-glacial periods over the last 800,000 years! If global warming proponents want something to shout about then kindly (if they can) then kindly explain to me why a measly 2° increase would be relevant and do so by means in which you’d be able to impart why the previous inter-glacial period was damn near 13° F warmer than this inter-glacial period we’re currently living in. According to the above article, it states the “peak Antarctic interglacial temperature” was at least 6 K (6° C) higher than that of present-day [average global mean temperature].
If the average global mean temperature increases, let’s say, 9° C, or 1° F is the equivalent of a temperature difference of 0.556° C, that would mean 9° C / 0.556° C = 16.2° F. According to the records kept by the World Meteorological Organization, 57.2° F was the average global mean temperature back in 1960 and 1961, so for this interglacial period to be the “warmest on record” just so global warming proponents can hurl confetti in the air and scream collectively and exhalt their jubilation, that would mean…
….57.2° F + 16.2° F = 73.4° F would have to be the average global mean temperature today–and it’s not! Let me re-iterate: this is the coldest interglacial period out of the previous eight interglacial periods, so how could our globe, our Earth, our home be “warming” if the global mean temperature is colder than the global mean temperatures from over 800,000 years before?